

Updated: June 2024
There are a number of methods that are currently used to obtain population estimates for stocks or populations of whales and seals. Visual surveys where animals are counted from ships or aircraft are carried out. Other approaches combine visual and acoustic techniques, for example using sonobouys to detect the presence of vocalizing animals. Another method is known generally as the “mark- recapture” method, a method which will be discussed further here.
It is impossible to get an exact count or census of how many whales or seals might be in a population—you could never see and count every single individual, or know that you have actually seen and counted every one. Managers therefore rely on population estimates, or a value obtained based on sampling of the population. An estimate is not just a “guess”, but in this context is a statistical term meaning that the population number is calculated from samples taken. Statistical population estimates come with an indication of their accuracy or reliability, in the form of a standard error or confidence interval.
The mark-recapture method is a common way of obtaining a population estimate. First developed in the late 1800s by C.J.G. Petersen for studies of marine fishes and later used in the 1930s by F.C. Lincoln for birds, the method goes by many names: the Lincoln-Petersen method, the Petersen method, the Lincoln method, or as the capture-recapture, (capture-)mark-recapture, sight-resight, or mark-release-recapture method.
Since its development, the method has been used to estimate the populations of a wide variety of species. In addition to fish and birds, the method has been used for bees (Tosta et al. 2017), turtles (Hasler et al. 2015), and chimpanzees (Moore and Vigilant 2014), just to name a few recent examples.
The basic method involves taking two samples of the population being studied. In the first sample, individuals from the population are captured, marked in some way, and then released back into their environment. Later on, a second sample is taken from the population and the number of marked individuals is recorded. The main assumption of the method is that the number of marked individuals found in the second sample is proportional to the number of marked individuals in the whole population, and so an estimate of the total population size is obtained by dividing the number of initially marked individuals by the proportion of marked individuals in the second sample.
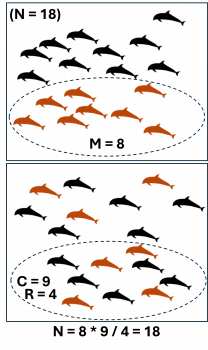
Illustration of mark-recapture theory: in the first survey, a portion (M) of the total population (N) is marked. In the second survey, a different portion (C) is captured, which includes only some (R) of the originally marked animals.
Mathematically, it looks like this, where:
- N is the total population size
- M is the number of individuals marked in the first sample
- C is the total number of animals captured in the second sample
- R is the number of marked animals found in the second sample, or “recaptures”
The assumption as stated above is that R:C = M:N, and so by rearrangement the population size is calculated as N = M · C / R
In using this method, several additional assumptions are made about the population being studied. The first is that the population is assumed to be “closed”, that is to say that during the time between the first and second samples, nothing has happened to change the proportion of marked to unmarked animals—no new individuals were born or immigrated into the population, and none died or emigrated.
The length of the sampling period is therefore important for this method. The shorter the time interval between marking and recapturing individuals, the likelier the assumption is to hold. A longer time interval between the first and second samples means a greater chance that some individuals will die, emigrate, immigrate or even be born making the population “open” instead of closed. A long period between sampling could also result in some marked animals losing their marks, which would affect the population estimate calculation. The time interval between sampling must not be too short, however, since another assumption is that the marked animals become randomly dispersed throughout the population, and they may need some time to do this.
A third assumption is that both the marked and unmarked individuals have an equal probability of being captured. The marks used must not make those individuals more (or less) likely to be caught in the second sample. As well, they must not make those animals more likely to die, either from predation or the mark itself. At the same time, the mark must be obvious enough so that all marked animals in the second sample are found and reported.
There are modifications of the method that allow some of these assumptions to be relaxed, particularly using models that don’t assume a closed population. These models generally involve more sampling effort, and more complex statistical calculations—see Hammond (1986) for an overview of some of these models. More detailed discussions of the models and the statistics used may be found in the books listed in the bibliography section at the end of this page. One of the more common methods for open populations is called the Jolly-Seber method, in which both marking and sampling are done several times. By keeping track of capture histories for individual animals over several sampling periods, this method allows the calculation of both additions to and removals from the population.
Artificial tags
There are many different ways of marking animals. The method chosen depends on the species being studied, as well as the purpose of the mark. There are various types of “tags” that can be applied to an animal’s body—these can be quite small, as used for fish, or larger tags as used on cattle or other domestic animals. Birds are commonly “banded” with metal or plastic rings fastened around a leg. Other ways of marking animals can involve the use of paint, tattoos, stickers or implanted microchips.
There have been some attempts to attach tags to whales. In the 1930s, the British Discovery research programme used stainless steel tube tags which were shot into the blubber and muscle of large whales in the Southern Ocean. Each tag had a serial number and an offer of a reward, and was to be returned if the whale was later killed. Discovery tags were used up until the 1970s, and for some of the large whales of the Southern Ocean provided the only source of data on their movements. Most of the tags deployed, however, were not recovered.
Over the years, other types of tags were tried with limited success (see Reeves 1998 for an overview). “Spaghetti” or streamer tags which could be attached near the dorsal fin and seen when the whale surfaced were used but these were often not easy to see and also tended to fall off after a short period of time. Other types of tags such as button or disc tags placed on the dorsal fin, freeze brands, and notches cut into the dorsal fin have been tried on smaller whales or dolphins. Because these latter types of tags involve capturing and restraining the animal for at least a short period of time, they are not feasible for use with larger whales.
Tracking whales using radio telemetry began in the 1960s. Since that time, there has been some success with radio tags and more recently satellite tags on various species of whales. Two main types of tag attachment are currently used, each with advantages and disadvantages. Since the 1990s, transdermal attachments have been used for satellite-monitored tags to document long-term movements of whales over a period of months. Retention of these tags is the biggest challenge, as the whale’s skin naturally rejects foreign objects. Some have stayed on and functioned for up to a year, however the amount of information that can be transmitted is limited, since the data can only be recovered through the Argos satellite system. Data loggers attached by suction cups are the second main type of “tag” used. These can record information such as dive depth, body orientation, water temperature etc., but the large quantities of data generated cannot be sent via satellite, so they are stored on the device for download after the tag is recovered. This generally occurs within 24 hours of deployment on large cetaceans, though there have been a few cases where they stayed on a little longer (see Mate et al. 2017).
With advances in technology, satellite tags have become both smaller and more powerful. Mate et al. (2017) describe a transdermally attached biologging device called the Advanced Dive Behavior (ADB) tag. Around 9cm in diameter, this tag contains three-axis accelerometers, magnetometers, as well as sensors that record hydrostatic pressure, water temperature, and light level. The ADB tag also collects GPS locations. The tag has been deployed on sperm, blue and fin whales, and has lasted in one case for just under 50 days. Tags are release when a wire corrodes, and can then be recovered and their data downloaded.
While both radio and satellite tagging provide valuable information about the movements and behaviour of whales, these types of tags are not useful in obtaining a population estimate. As mentioned above, these tags remain attached to the whale for mostly short periods of time. As well, it is not possible or practical to attach the number of tags to a species or stock that would be needed in order to obtain a reliable population estimate. However, there are ways in which whales are naturally “marked” which can be used: natural variation in colouring or fin/fluke shape recognised through photo ID, and their DNA.
Photo identification or Photo ID
Since the 1970s, variation in colouring or the distinctive shapes of flukes or fins has been used to identify individual whales. Various features are used, depending on the species being studied. Humpback whales, for example, have unique pigment patterns on the ventral surface of their tail flukes which are present from birth. The trailing edge of the flukes also has distinctive scalloped patterns which can be used to recognize individuals. Dorsal fin shape may be used for species with a prominent fin such as killer, fin or minke whales or smaller species such as dolphins. Right whales, which lack dorsal fins, can be identified by the patterns of callosities, wart-like growths which form on the tops of their heads and lower jaws (Fairfield 1990). In any species, persistent scars on visible parts of the body are another feature which can be used to distinguish individuals.
At first, the information obtained through individual identification was used primarily for life history studies into distribution, migration, and behaviour, but it was soon realised that data on re-sightings of individuals could also provide valuable information on abundance, survivorship, reproductive rates, and population or stock differentiation (Hammond et al. 1990, Hammond 1986).
In order to use photo ID, detailed photographs of the individuals are taken and catalogued. Individuals encountered on later surveys are also photographed. All new photographs are compared to existing photos either by sight, or, increasingly, by using automated techniques with specially developed software to see if there is a match. With photo ID, individuals can be recognised against the rest of the population during different sampling periods, usually over a long period of time.
One advantage of photo ID is that anyone with a camera can assist with the research. In many areas, members of the public are encouraged to submit their photos, which increases the number of photos and hence the data available. Two examples for humpback whales are the WhaleNet humpback catalogue and a catalogue maintained by the Canadian Dept. of Fisheries and Oceans.
Another big advantage of using photo ID is that it is non-invasive, that is that the animal does not need to be captured or handled in any way. For most adult whales, the marks or colouring do not tend to change over time, so the individual can be identified over a long period. As well, since the marks are natural, they won’t affect the animals’ behaviour in any way so that probabilities of future capture and survival are unaffected. In addition to using these “marks” to make a population estimate, keeping track of individuals provides other valuable information such as movement or migration patterns, habitat use, or behaviour.
The disadvantages of using photo ID is that some animals do change colouring or the shape and size of notches in their dorsal fins as they age, so it may not be useful in identifying younger animals. As well, some individuals look very similar, so that a good “look” from a specific angle or a detailed photo of a specific body part or area is needed in order to tell them apart. As more photos are added to the database, the process of matching these to existing photos can be very time consuming. New developments in software and automated analysis of digital images have assisted with this problem.
For similar looking animals, there is the possibility of making mistaken identifications. For example, if two photographs of two separate individuals are matched by mistake, a “false positive” identification will result. On the other hand “false negatives” can also occur when two photographs of the same individual are not matched. A false positive will result in an underestimation of the population size, while a false negative will result in an overestimation (Gunnlaugsson and Sigurjónsson 1990).
Photo ID works best when the animals have markings that are easily distinguished, and either the population is small, or, for a larger population, has been extensively photographed.
DNA
Deoxyribonucleic acid, or DNA, is a molecule found in every living cell, which carries the genetic instructions that make each species, and every individual within a species, unique. Apart from identical twins (triplets etc.) or clones, each individual living thing on the planet has its own “version” of DNA. This means that each individual carries within themselves their own unique and permanent “mark”, and as such can be used as the mark in mark-recapture methods to obtain a population estimate. This first became feasible in the late 1990s (Palsbøll et al. 1997). This method can be used for species which lack distinctive colouration or markings, and individuals which can’t be distinguished by sight or through photo ID.
As well as providing unique identification for individuals, DNA analysis allows the sex of each animal to be determined. This is an advantage, as it means that separate abundance estimates can be calculated for males and females.
To obtain DNA from whales, a sample of tissue is collected using a biopsy dart. Only a very small amount of tissue is needed, on the order of 10s of mg. The earliest method of doing this used modified harpoon heads, but in the late 1980s a smaller and less invasive technique was developed, with a biopsy tip or dart on the end of a modified arrow fired from a crossbow (Lambertsen 1987). The biopsy tip is a hollow stainless steel tube usually from 10 to 50mm long with an internal diameter of 6–10mm (Palsbøll et al. 1991). Small barbs or hooks on the inside of the tube ensure that the tissue stays in the tip after hitting the whale. Prongs or a flange behind the tip prevent it from penetrating too deeply into the whale’s skin. The bolts or arrows are retrieved after hitting the whale. Some bolts have flotation on them, so that they float at the surface until they can be retrieved. Others remain attached to whatever fired them by fishing line and so can be retrieved that way.
Other types of gear have been used to shoot the sampling dart, including compound bow, rifle, airgun, and speargun (Palsbøll et al. 1991, Amos and Hoelzel 1990). Sampling whales with this method appears to be minimally invasive, and the animal does not need to be captured or restrained in any way. Studies specifically looking at the effects of biopsy sampling show that is has only a minor and temporary impact on the whales (e.g. Brown et al. 1991, Weinrich et al. 1991, Best et al. 2005).
Tissue for DNA analysis can also be obtained by collecting samples of sloughed skin (Whitehead et al. 1990, Amos et al. 1992, Valsecchi et al. 1998). Whales breaching or being active at the water’s surface naturally slough off pieces of skin which are large enough to be skimmed off the water using a small net. Samples of skin, however, can only be collected on an opportunistic basis and do not always provide enough high quality DNA.
Now that there is a population of “marked” animals, through the use of photo ID or their DNA, a population estimate can be made using the mark-recapture method. In some cases, both photo ID and DNA have been used simultaneously (e.g. Smith et al. 1999).
In the simplest case, sampling is done over two time periods. In the first period, animals are either photographed or biopsied for a DNA sample. The total number of whales photographed or biopsied would be the “M” value described earlier, or the number of marked animals in the first sample. In the second sampling period, whales are again photographed or biopsied. Researchers look for any matches in the total number of whales sampled during the second period (C) with those whales photographed or biopsied in the first sample. Any such match constitutes a “recapture” (R), and a population estimate can be calculated as described earlier:
N = M · C / R .
While the population size may be easy to calculate using this method, the value of the results obtained depends significantly on how well the assumptions of the applied model are met. The same assumptions as discussed earlier are made for these studies. The first is that the population is “closed”, that is that no new individuals enter the population and that none leave. This assumption can be relaxed for the two sample Petersen model. In particular, if there are no births between the first and second sample, the Petersen model can give a valid population estimate at the time of the first sample even if there is mortality in the population (Hammond et al. 1990). If there are changes in the population between the sampling periods due to births and deaths, then an open population model such as the Jolly-Seber model must be used.
Before beginning any mark-recapture study, the population being studied must be defined. Any population estimate made must refer to a specific stock or population of animals. This is especially important for cetaceans, as some populations range over entire ocean basins, with movements often occurring in response to prey distribution. Ideally, any photo ID or biopsy sampling would be done in an area where the whole population is known to return to on a regular basis. An example would be the breeding grounds for North Atlantic humpback whales, where the majority of the population congregates during the winter to mate and calve (Smith et al. 1999). If there is no such area, then sampling should be done randomly over the known range.
Another assumption of mark-recapture studies is that every individual in the population has an equal chance of being sampled, both during the first and second sampling periods. This is not likely to hold, for various reasons. Some types of whales, for example, are harder to get close to for either a photo or a biopsy than others. The process of “marking” the whales, either through photography or biopsy, may also affect their future behaviour. Whales may react adversely to the presence of a boat or aircraft and swim away, or in some cases become habituated to boats and will approach them (Hammond et al. 1990). In the first case, the animals would have a reduced probability of being photographed or biopsied during the second sampling period, while in the latter case their probability of being photographed or biopsied might be increased. Such differences in behaviour affect the “catchability” of each individual animal. This individual variation is often referred to as heterogeneity, and occurs at least to some extent in mark-recapture studies. It generally results in negative bias and an underestimate of the population size (Hammond 1990). There are models available which take capture heterogeneity into account, for example see Huggins (1989).
For Photo ID, there are additional considerations. For all whales to have an equal probability of having their natural markings photographed, the behaviour which results in the markings being visible and able to be photographed must be characteristic of every individual. If some whales, for example juveniles or females, are naturally more difficult to photograph than others or cannot be photographed at all, the resulting heterogeneity of capture probabilities will cause an under-estimation of population size (Hammond 1990, Hammond 1986).
How the photographs are used is another consideration. Not all whales photographed should be necessarily considered to be “marked”, unless it is certain that it will be recognised again in a future photograph of acceptable quality. If the quality of the photo is poor, or if the markings on the whale are indistinct, then these photos should not be included in the sample, as this will introduce possible errors (Hammond 1990).
In either case, using photo ID or DNA, the equal probability of capture is unlikely to occur in the field. The goal of any population study should be to try to reduce any negative bias resulting from heterogeneity by making capture probabilities as equal as possible, and by having large sample sizes (Hammond 1986). Larger sample sizes will also allow a more precise population estimate to be made.
Amos B and Hoelzel R (1990) DNA Fingerprinting Cetacean Biopsy Samples for Individual Identification. Rep. Int. Whal. Commn. Special Issue 12:79-86. SC/A88/ID29.
Amos W, Whitehead H, Ferrari M.J et al. (1992) Restrictable DNA from sloughed cetacean skin; its potential for use in population analysis. Mar. Mamm. Sci. 8:275-283.
Best P B, Reeb D, Rew M B et al. (2005) Biopsying southern right whales: their reactions and effects on reproduction. J. Wild. Mgmt. 69(3):1171-1180.
Brown M W, Kraus S D and Gaskin D E (1991) Reaction of North Atlantic right whales (Eubalaena glacialis) to skin biopsy sampling for genetic and pollutant analysis. Rep. Int. Whal. Commnn. Special Issue 13:81-89
Fairfield C P (1990) Comparison of Abundance Estimation Techniques for the Western North Atlantic Right Whale (Eubalaena glacialis). Rep. Int. Whal. Commnn. Special Issue 12:119-126. SC/A88/ID367
Gunnlaugsson T and Sigurjónsson J (1990) A Note on the Problem of False Positives in the Use of Natural Marking Data for Abundance Estimation. Rep. Int. Whal. Commnn. Special Issue 12: 143-146. SC/A88/ID46
Hammond P S (1986) Estimating the size of naturally marked whale populations using capture-recapture techniques. Rep. int. Whal. Commn. Special issue 8:253-282.
Hammond P S (1990) Heterogeneity in the Gulf of Maine? Estimating Humpback Whale population size when capture probabilities are not equal. Rep. Int. Whal. Commnn. Special Issue 12:135-140. SC/A88/ID4.
Hammond P S, Mizroch S A and Donovan G P (Eds.) (1990) Special issue 12: Individual Recognition of Cetaceans: Use of Photo-Identification and Other Techniques to Estimation Population Parameters. i-v + 440 pp. Rep. Int. Whal. Comm.
Hasler C, Robinson K, Stow N et al. (2015) Population size and spatial ecology of Blanding’s Turtle (Emydoidea blandingii) in South March Highlands, Ottawa, Ontario, Canada. Can. J. Zool. 93(7):509-514.
Huggins R M (1989) On the statistical analysis of capture experiments. Biometrika 76: 133–140.
Lambertsen R H (1987) A biopsy system for large whales and its use for cytogenetics. J. Mammal. 68:443-445.
Mate B, Irvine L M and Palacios D M (2017) The development of an intermediate-duration tag to characterize the diving behavior of large whales. Ecol.Evol. 7(2):585-595.
Moore D and Vigilant L (2014) A population estimate of chimpanzees (Pan troglodytes schweinfurthii) in the Ugalla region using standard and spatially explicit genetic capture-recapture methods. Am. J. Primatol. 76(4):335-346.
Palsbøll P J, Allen J, Bérubé M et al. (1997) Genetic tagging of humpback whales. Nature 388:767-769.
Palsbøll P J, Larsen F and Hansen E S (1991) Sampling of skin biopsies from free-ranging large cetaceans in West Greenland: Development of new biopsy tips and bolt designs. Rep. Int. Whal. Commnn. Special Issue 13:71-79.
Reeves R R (1998) History of marine mammal tagging. Background paper, Marine Animal Telemetry Tags workshop. New England Aquarium, Boston, MA 14-15 May 1998. Census of marine life secretariat. Retrieved Oct. 2017 from:
http://www.comlsecretariat.org/wp-content/uploads/2010/06/History-of-Marine-Mammal-Tagging.pdf
Smith T D, Allen J, Clapham P J et al. 1999. An ocean-basin-wide mark-recapture study of the North Atlantic humpback whale (Megaptera novaeangliae). Mar. Mamm. Sci. 15(1):1-32.
Tosta T, Silveira G, Schiavini I et al. (2017) Using short-term surveys and mark–recapture to estimate diversity and population size of orchid bees in forest formations of the Brazilian savanna. J. Nat. Hist. 51(7/8):391-403.
Valsecchi E, Glockner-Ferrari D, Ferrari M et al. (1998) Molecular analysis of the efficiency of sloughed skin sampling in whale population genetics. Mol. Ecol. 7(10):1419-1422.
Weinrich M, Lambertsen T, Baker R H et al. (1991) Behavioural responses of humpback whales (Megaptera novaeangliae) in the southern Gulf of Maine to biopsy sampling. Rep. Int. Whal. Commnn. Special Issue 13: 91-97.
Whitehead H, Gordon J, Mathews E A et al. (1990) Obtaining skin samples from living sperm whales. Mar. Mamm. Sci. 6:316-326.
Amstrup SC, McDonald TL, Manly BFJ (2005) Handbook of capture-recapture analyses. Princeton and Oxford: Princeton University Press.
McCrea, R. S. and Morgan, B. J. T. (2014) Analysis of Capture- Recapture Data. Chapman & Hall/CRC Interdisciplinary Statistics. Boca Raton, Florida: Taylor & Francis Group
Royle, J., Chandler, R., Sollmann, R., and Gardner, B. (2013). Spatial Capture-Recapture. Amsterdam/Oxford/Waltham: Elsevier Science.
Seber, G. A. F. (1987). Estimation of Animal Abundance (Second Edition). London, United Kingdom