7 May 2020: New Article on Sei Whale Distribution Published

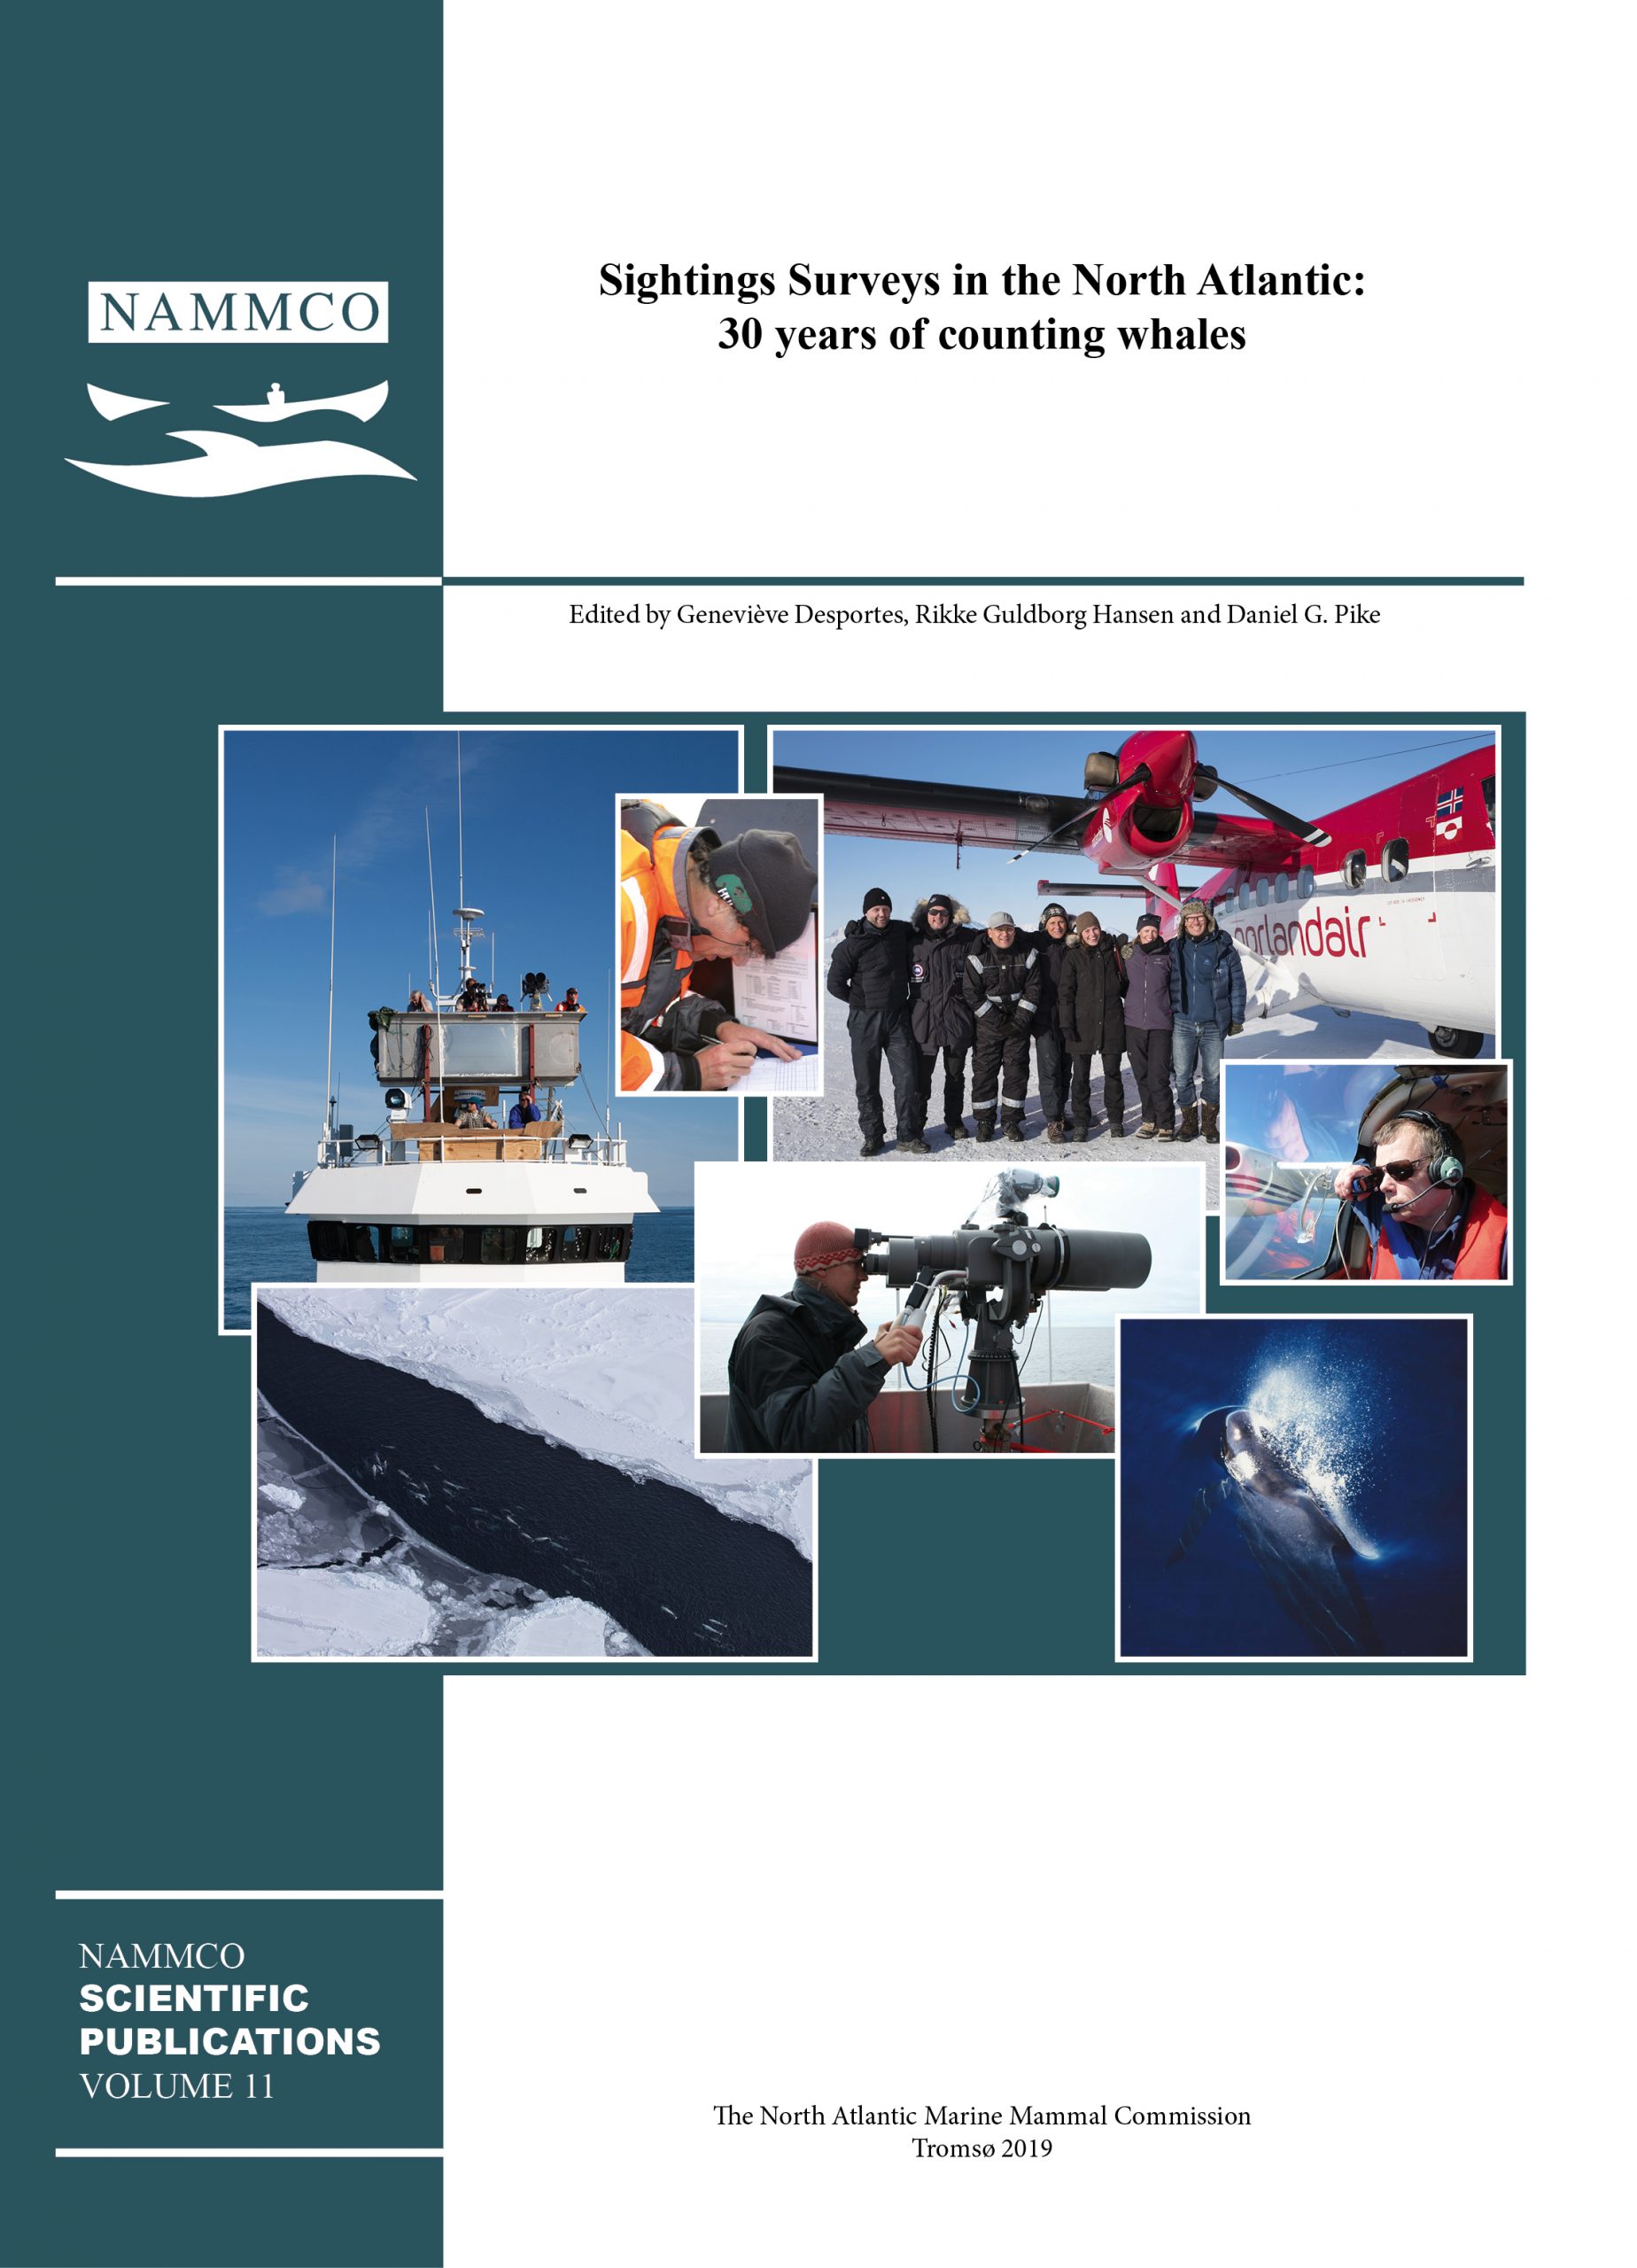
We are pleased to announce that the fourth article in the NAMMCO Scientific Publications Volume 11 – Sightings Surveys in the North Atlantic: 30 years of counting whales – has now been published online.
The article, Oceanic Drivers of Sei Whale Distribution in the North Atlantic, was authored by Lucy E. Houghton, Nadya Ramirez-Martinez, Bjarni Mikkelsen, Gísli Víkingsson, Thorvaldur Gunnlaugsson, Nils Øien, and Philip S. Hammond.
Given how little is known about sei whales in the North Atlantic, we are particularly excited to publish this article exploring how their distribution has changed over time and the different oceanic drivers involved.
Abstract
This study investigated the oceanic drivers of sei whale (Balaenoptera borealis) distribution in the central and eastern North Atlantic, and explored how distribution may have changed over almost three decades. Cetacean sightings data were available from Icelandic, Faroese and Norwegian surveys conducted throughout the central and eastern North Atlantic during summer between 1987 and 2015. Effective strip half width was estimated from the data to take account of variation in detection probability. Spatially-referenced environmental variables used as predictors in generalised additive models of sei whale relative density included: relief-related variables seabed depth, slope and aspect; monthly-varying physical oceanographic variables sea surface temperature (SST), mixed layer depth, bottom temperature, salinity, and sea surface height anomaly (SSH); and monthly-varying biological oceanographic variables chlorophyll-a concentration and primary productivity. Preliminary analysis considered which month (March-August) in the dynamic oceanographic variables explained most variability in sei whale density. Models including all variables (“full models”) could only be run for 1998-2015 because data for several variables were missing in earlier years. “Simple models” including only relief- related variables and SST were therefore run for 1987-89, and also for 1998-2015 for comparison. The best-fitting full model for 1998- 2015 retained the covariates depth, May SST, May bottom temperature, July salinity, July SSH and July primary productivity. Of these, depth, May SST and July SSH were the strongest predictors of sei whale density. In the simple models for both 1987-89 and 1998- 2015, depth (especially), May SST and seabed slope were the strongest predictors of sei whale density. The highest densities of sei whales were predicted in the Irminger Sea and over the Charles-Gibbs Fracture Zone; a pattern driven by large negative SSH, deep water (>1500m) and polar-temperate SST (5-12°C). There was some inter-annual variability in predicted distribution and there appears to be a northward expansion in distribution consistent with prey species responding to ocean warming. The models could potentially be used to predict future distribution of sei whales based on future environmental conditions predicted by climate models.
Read the full article here
Learn more about sei whales here.


