

Updated: January 2025
In order to effectively manage human impacts on marine mammals, we need to know how many animals are in the management area. We also need to know if this number is changing over time, i.e. is the population going up or down? The best way to get this information is to carry out surveys to estimate the abundance of whales or seals in specific areas. Repeating surveys over time helps to determine if the population is growing or declining.
Why do we count whales?

The future abundance of animals depends on several factors. Wildlife managers usually have knowledge of only abundance and catch.
Surveys aim to generate estimates of absolute abundance, which is the number of animals in a specific area at a specific time. In some cases, estimates of relative abundance (a fraction of absolute abundance that is assumed to be constant) are also useful. Trends in abundance (whether the number of animals is increasing or decreasing or stable) can be estimated by repeating surveys over time. The main use of these estimates is for the management of whale and seal populations. They are also used for general environmental monitoring and ecosystem research.
Marine Mammal Management
“Management” does not mean telling whales what to do! It is actually the management of human impacts on whale populations, which primarily includes direct catch (hunting) and indirect catch (by-catch, ship strikes), but also other impacts such as pollution and climate change. The main goal of management is usually to ensure that human impacts on marine mammal populations are sustainable, meaning that they do not cause the populations to decrease below a pre-defined threshold. To do this, estimates of abundance are combined with past, present and projected future catch levels in a population model – a mathematical model that mimics the response of the population to catch. This enables managers to set allowable direct and/or indirect catch levels that will not endanger the population.
How do we count whales?
The abundance of whales and seals is usually (though not always) estimated using distance sampling, or line transect, surveys. These surveys are conducted at sea using either ships or aircraft. Generally, ships are used for large offshore areas, whereas aircraft are more useful for smaller nearshore areas. Another method for estimating the abundance of whales and seals is mark-recapture.
Survey Design

Survey design for the Icelandic coastal aerial survey. Image: Dan Pike
The survey area is usually divided up into smaller areas, called strata. Survey effort—the amount of time or distance the survey vessel will spend in the area—is divided between strata based on how common the target species is expected to be. Generally speaking, more effort is given to areas with high densities, because this produces a more precise estimate. The survey vessel sails or flies a series of predefined transects that cover each stratum in the survey area. The transects are designed in advance of the survey to cover the area evenly.
Counting animals
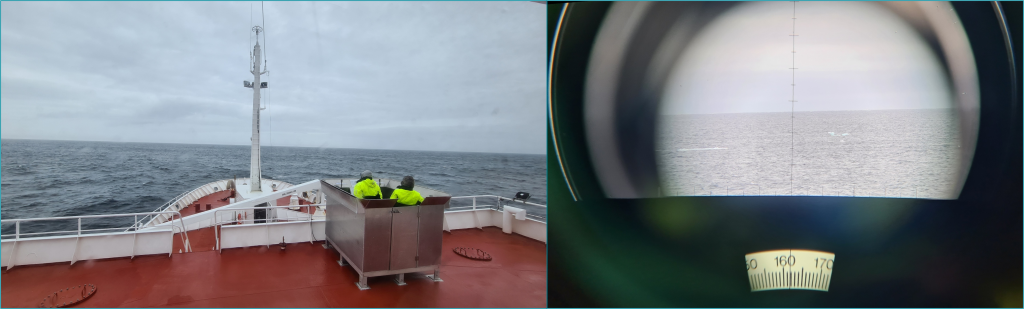
Visual surveys, which use human observers to count animals, are the most common type. Observers concentrate on the area ahead of and beside the vessel. When an observer sees an animal or group of animals, they immediately record the observation, noting such things as species identity, group size and the number of young in the group. The observer then takes a measurement of the perpendicular distance – the distance at 90 degrees to the direction of travel – to the animal or group. These distances are later used in a statistical analysis to estimate the width of the strip that is being surveyed by the vessel.
Aerial photographic surveys are often used for seals, which haul out on land or ice. An area of known size is photographed and the animals are later identified and counted on the photos.


Estimating Abundance
The collection of perpendicular distances in visual surveys allows the analyst to estimate the width of the strip that is surveyed for a particular species. Knowing the area that was surveyed, and the number of animals that were seen, the density of animals in the area can then be calculated as:
No. animals / Area surveyed = No. animals per unit area
For example, if 2 whales are seen in a surveyed area of 2 square kilometres, there is a density of 1 whale per square kilometre. This density is then applied to the entire stratum to estimate the number of animals. Another example – if there is 1 whale per square kilometre and the stratum has an area of 10 square kilometres, we would estimate that there are 10 whales in the stratum. Of course the calculations are much more complex than this in reality. The estimate of density has variance – a measure of uncertainty of the estimate. Abundance estimates are therefore always expressed with a measure of uncertainty, usually a 95% confidence limit. Using confidence limits means that instead of saying that “there are 10 whales in the stratum”, we instead say “There are about 10 whales in the stratum, maybe as many as 15, maybe as few as 5”.
North Atlantic Sightings Surveys – NASS
The North Atlantic Sightings Surveys (NASS) are internationally coordinated cetacean surveys conducted in 1987, 1989, 1995, 2001, 2007 (Trans-NASS, T-NASS), 2015, and 2024. Their primary objective is to obtain quantitative data on the distribution and abundance of all cetacean species across the survey area, spanning the northern North Atlantic from Norway to North America. These surveys are among the most extensive wildlife assessments ever, covering up to 2 million square nautical miles (equivalent to the size of Western Europe) and involving up to 15 ships, 4 aircraft, and 100 observers in a single survey. The combined distance travelled by ships and planes during surveys has exceeded 40,000 nautical miles, equivalent to twice around the world. Remarkably, a single survey has recorded sightings of up to 5,000 whales. The long time span of NASS makes them ideal for monitoring abundance trends. Since 1995, the NAMMCO Scientific Committee has planned and coordinated the NASS.
Participation
The earliest surveys (1987 and 1989) were the largest, involving the participation of 5 countries: the Faroe Islands, Greenland, Iceland, Norway and Spain. By 1995, Spain and Greenland were no longer participating and the survey area was consequently smaller. After 1995, Norway began surveying a portion of their area annually on a 6 year rotation. As a result, the area covered by Norway in 2001 and later surveys was smaller than in previous years. In 2007, Greenland and Canada participated in the survey, and it was coordinated with simultaneous surveys in offshore European waters (CODA survey) and off the US eastern seaboard (SNESSA survey). This made the T-NASS 2007 one of the largest ever and the first to achieve trans-Atlantic coverage. Greenland was also surveyed as part of the 2015 and 2024 NASS.
Target species
All species encountered are recorded on these surveys. However, each participating country has one or more target species—species that are of highest priority for the survey. This prioritisation may be because the species is harvested or subject to indirect take, or because of other conservation concerns. For example, the common minke whale is a target species for Norway because it is harvested there, while minke and fin whales are target species for Iceland for the same reason. The identification of target species influences survey design, in that the survey will cover areas where the target species is expected to occur and the stratification and effort allocation will be optimized for the target species.
Methods
Because of the huge area covered by the NASS, large ships are used to cover the offshore areas. Ships can stay in the field for weeks at a time and the entire area can take as long as a month to complete. Some coastal areas, notably Iceland, West Greenland and eastern Canada, have been covered by aircraft.
Abundance estimates
Estimates of abundance have been produced for all target species and many non-target species from the NASS and T-NASS. In 2009, the NAMMCO Scientific Publications published Volume 7: North Atlantic Sightings Surveys: Counting whales in the North Atlantic, 1987-2001, which was devoted entirely to the NASS up to and including the 2001 survey. In 2019 and 2020, the NAMMCO Scientific Publications is working to publish Volume 11: Sightings Surveys in the North Atlantic: 30 years of counting whales, which consists of a series of articles dealing with the results of NASS from 1987-2015, as well as other surveys in the North Atlantic in the period 1987-2016.
Many estimates have also been published elsewhere or produced as non-published working papers. These estimates have been used by the NAMMCO Scientific Committee, the Scientific Committee of the International Whaling Commission, and other agencies to provide advice on the conservation and management of many marine mammal stocks. Abundance estimates from the NASS are provided under the individual species pages, where applicable, and the most recent estimates are also available here.
Planned (dashed lines) and achieved (solid lines) transects of NASS 2024 survey platforms.
NASS 2024
The NASS 2024 surveys covered an extensive area of the North Atlantic, with multiple dedicated and opportunistic survey efforts undertaken by NAMMCO member countries. The survey aimed to provide updated abundance estimates for cetaceans across the region, building on previous NASS surveys and contributing to long-term monitoring efforts.
A total of approximately 8,299 nm of survey effort was completed, covering an extensive area of the North Atlantic. Surveys were conducted using a combination of aerial and ship-based methodologies between June and September 2024.
The analysis of cetacean distribution and abundance is currently underway, with initial results expected to be reviewed by the NAMMCO Working Group on Abundance Estimates in early 2025. A summary of preliminary findings is available in the reports from the Abundance Estimates Working Group, with further updates anticipated from national research institutions. A table presenting an overview of the estimates will be made available here once finalised.
Faroe Islands
The Faroe Islands’ survey efforts were ship-based, focusing on the abundance and distribution of pilot whales, while also recording other cetaceans in the region. The surveys also incorporated other data collection methods, such as acoustic monitoring and eDNA sampling.
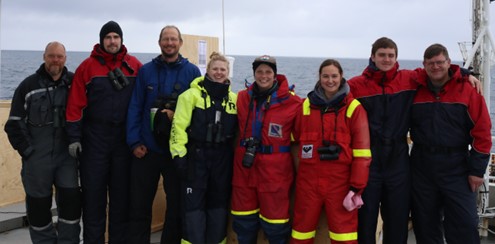
The Faroese NASS 2024 observer team onboard “RAN”. Left: Silas Olofson, Rúni Akralíð, Simon Keith, Sara De Clerck, Sofia Albrecht, Fiona Cummins, Markus Bjarnason and Bjarni Mikkelsen.
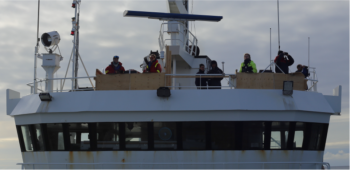
Platform arrangement onboard observer vessel “RAN” during NASS 2024.
Dedicated ship-based Survey
A dedicated ship-based survey was carried out from 27 June to 16 July using the vessel RAN. This effort covered waters south and west of the Faroe Islands, which, based on previous surveys, is considered a core pilot whale habitat. Throughout the vessel’s progress, passive acoustic monitoring was conducted with towed hydrophones—these can detect cetacean vocalisations and echolocation even when visibility is bad, thus recording the presence of animals that visual observers may have missed.
Opportunistic Survey
An additional survey was conducted on the Jákup Sverri as part of the IESSNS mackerel survey. During the survey, water samples were continuously collected for eDNA detection. Environmental DNA is “shed” by animals as they move through their habitat and, in the right conditions, can be collected and used to identify the species—sometimes right down to the individual! The use of eDNA as an alternative or complementary cetacean survey method is still in the early stages, meaning that samples gathered along with concurrent visual observations are crucial for the validation and fine-tuning of this technique.
Greenland
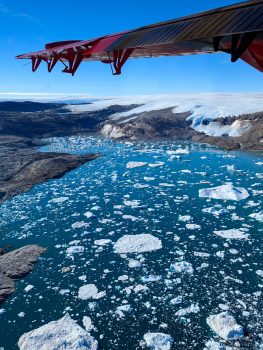
Flight along East Greenland for NASS 2024
Greenland’s survey efforts focused on aerial surveys covering both East and West Greenland. These surveys aimed to gather comprehensive data on cetacean distribution, particularly for species such as narwhals, belugas, and bowhead whales.
Aerial Survey
Aerial surveys in Greenland took place between 8 August and 18 September using a Twin Otter aircraft. Observers conducted systematic parallel transects perpendicular to the coastline (with smaller transects in selected fjord systems), recording cetacean sightings while adjusting for varying ice conditions. The surveys provided valuable population estimates for key Arctic whale and dolphin species.
Iceland
Iceland used opportunistic ship-based surveys to ensure comprehensive coverage of its waters, while also deploying a dedicated vessel to fill in the gaps between the Icelandic and Greenlandic surveys. The surveys aimed to assess population trends of key species such as minke and fin whales, fin whales.
Dedicated ship-based Survey
The dedicated Icelandic ship-based survey was conducted with the RV Bjarni Sæmundsson from 1 to 19 July. Due to extensive ice cover, an ice-edge protocol was employed for much of the survey and not all planned transects could be followed. Despite this, many interesting observations were recorded, which will shed light on the distribution of cetaceans and whether they congregate near the ice edge when migrating north. The ice also set a physical boundary for the calculation of the overall abundance of cetaceans across the survey area.
Iceland NASS 2024 onboard the Mackerel survey
Opportunistic Surveys
The RV Árni Friðriksson was employed for the IESSNS redfish and mackerel surveys, from 4 to 26 June and 1 July to 2 August, respectively. By placing cetacean observers on board, this platform of opportunity was used to survey the waters around and southwest of Iceland. Combined with the fisheries samples, these efforts can provide essential insights into interactions between cetacean and fish populations.
Norway
Norway conducted ship-based surveys, covering waters around Svalbard and Jan Mayen. The Norwegian survey efforts focused on updating abundance estimates for minke whales.
Dedicated ship-based Survey
The dedicated ship-based survey was conducted as part of the NILS programme, a mosaic survey that covers a different part of Norway’s waters over a six-year cycle. This year, efforts were focussed on waters around Svalbard and the western Barents Sea. The survey took place from 19 June to 14 August, on the RV Stålbas. Although there was considerable interference from foggy conditions, sufficient coverage was provided to complete the latest mosaic cycle.
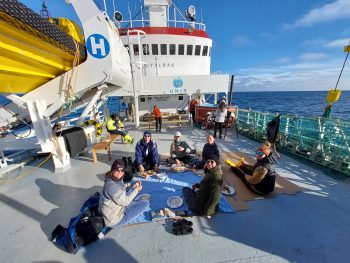
Lunch break during the Norwegian NASS 2024 dedicated survey
Opportunistic Survey
Additional cetacean observations were gathered during the IESSNS mackerel survey, which ran in two legs from 2 July to 1 August aboard the M/S Eros. This effort covered waters from Bergen northwards beyond Jan Mayen, following parallel transects as is typical of fisheries surveys.
Survey Challenges and Outcomes
The NASS 2024 surveys faced several challenges, including poor weather conditions, vessel availability issues, and logistical constraints. These factors impacted coverage and required modifications to the original survey design. Despite these difficulties, the surveys successfully gathered valuable data across the North Atlantic.
One notable development was the increased public outreach efforts. Real-time survey updates were shared online, helping to raise awareness of the survey’s scope and the work of cetacean researchers. For logs and reports from survey participants, visit NASS 2024 Survey.
NASS 2015

Transects that were surveyed during NASS2015.
Nations: 4 (Faroe Islands, Greenland, Iceland, Norway)
Area (nm2): 1,200,000 nm2
Effort (nm): 21,277 nm
Ships: 4
Planes: 2
T-NASS 2007

NASS-2007 map showing realized transect effort by participating nation.
Nations: 5 (Canada, Faroe Islands, Greenland, Iceland, Norway) and coordination with European CODA and American SNESSA surveys
Area (nm2): 1,298,088 nm2
Effort (nm): 12,440 nm
Ships: 6
Planes: 4
NASS-2001

NASS-2001 map showing realized transect effort by participating nation. After 1995 Norway started a 6-year cycle of “mosaic” surveys, covering a part of its area annually.
Nations: 3 (Faroe Islands, Iceland, Norway)
Area: 742,401 nm2
Effort: 10,715 nm
Ships: 6
Planes: 1
NASS-1995

NASS-1995 showing realized transect effort by participating nation.
Nations: 3 (Faroe Islands, Iceland, Norway)
Area: 1,609,332 nm2
Effort: 21,309 nm
Ships: 15
Planes: 1
NASS-1989

NASS-1989 showing realized transect effort by participating nation.
Nations: 4 (Faroe Islands, Iceland, Norway, Spain)
Area: 1,987,570 nm2
Effort: 28,965 nm
Ships: 11
Planes: 0
NASS-1987

NASS-1987 showing realized transect effort by participating nation.
Nations: 5 (Faroe Islands, Greenland, Iceland, Norway, Spain)
Area: 1,311,071 nm2
Effort: 27,633 nm
Ships: 7
Planes: 3
Trends in Abundance
Populations of animals may grow or decline in abundance for many reasons. For example, if many animals are taken by hunters and they are not replaced quickly enough by natural reproduction, a population will decline. A population might increase in abundance if it had previously been reduced to a low level but hunting had since ceased. The detection of trends in abundance is of great importance to management because it is important to know if the management measures taken are having the desired effect on the population.
Many species of whales live a long time and don’t have calves very frequently. As a result, whale populations tend to change slowly, neither rising nor falling very quickly. This makes the detection of changes in whale populations difficult, because only small changes can be expected from year to year. In addition, abundance estimates are approximations, with variance expressed as a 95% confidence interval. This means that a change in abundance between two or more surveys can only be detected if the difference in abundance falls outside of the overlap between the confidence intervals.
Surveys
The detection of trends in abundance requires two or more surveys, usually separated by several years so that some change can be expected. The surveys must cover the same area, which ideally must include most of the range of the population being surveyed since animal distribution can change from year to year. Finally, the surveys should be conducted at the same time of year because many whales migrate seasonally.
Six NASS have been carried out over a period spanning more than 20 years (1987 to 2015). These surveys therefore provide a good opportunity for detecting trends in abundance over that period. However, the survey area has changed over that period and one survey (1989) was conducted later in the year than the others. Therefore not all the survey data can be used to look for trends.

T-NASS 2007, showing the Common Area that has been covered in all surveys since 1987 in red. The Common Area is divided into E and W sub-regions.
Detecting trends: Pilot whales as an example
Pilot whales are taken every year in drive hunts in the Faroe Islands. Therefore trends in abundance of pilot whales in this area are of great interest to management to understand if the population is increasing or decreasing over time. Although six NASS have been carried out between 1987 and 2015, only a relatively small proportion of each survey area, the common area, has been covered every time. To look for trends, the abundance of pilot whales was estimated in the E and W common areas for each survey. While there appears to have been some decline in abundance estimates, the high degree of uncertainty within survey estimates means that this apparent decline is not statistically significant. In contrast, highly significant trends have been detected for fin and humpback whales.

Frequently asked questions
1. Question: Do surveys count all the whales in the survey area?
Answer: No they don’t. The survey design usually allows only a small proportion of the total survey area to be viewed by observers. Therefore they are likely to see only a similar proportion of the total number of whales in the area. Total abundance is estimated using the density of animals on the transects.
2. Question: It is easier to see whales that are close to the observer than those that are farther away. How do you account for that in estimating abundance?
Answer: Most modern surveys use a method called “Line Transect”. In such a survey, the observers measure or estimate the perpendicular distance to every group of whales they see. As expected, in most cases more whales are seen nearby than farther away, simply because it is more difficult to see things that are far away. However some species of whales are large and easy to see, while others are small and hard to spot. For example, a fin whale is much easier to see and can be seen from farther away than a minke whale. As a result, the distribution of perpendicular distances is different for each species.
Analysts use this distribution to estimate the “effective strip width” for each species. The effective strip width corresponds to the width of the strip that is actually surveyed by the observers on the ship or plane. As you would expect, effective strip width tends to be narrow for species like minke whales that are small and hard to see, and wider for species like fin whales that are large and easier to see from a distance.
Effective Strip Width
-
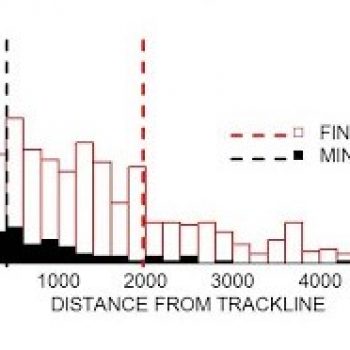
- The effective strip width (dashed lines) is estimated for each species based on the frequency distribution of perpendicular distances to sightings.
-
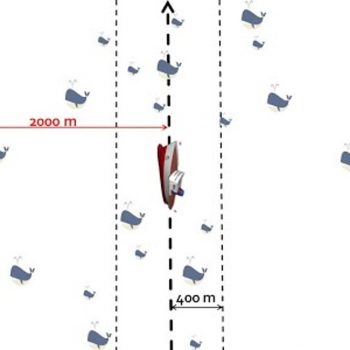
- Effective strip width for minke (small) and fin (large) whales. Fin whales can be seen from farther away than minke whales.
3. Question: Observers are not perfect and even the best observer is going to miss seeing some whales. How do you account for whales that are missed by observers?
Answer: The line transect method assumes that all animals close to the transect are seen by observers, but human observers do miss whales, even when they are nearby. This problem is usually addressed by having two separate teams of observers operating from the same ship or plane. The two teams usually operate independently, meaning they don’t communicate with each other about sightings. Often the teams see the same whales, but sometimes one team records a sighting that is missed by the other. The proportion of missed sightings for each team, along with the distance data gathered by the teams, enables the analyst to estimate the proportion of visible whales that were missed during the survey. This is used to correct the estimate of abundance.
4. Question: Some whales stay underwater for long periods of time and would not be visible to observers when the ship or aircraft passes by. How do you account for these “missing” whales?
Answer: This is indeed a very difficult problem for whale surveys. There are two approaches to address the issue of whales that are diving and therefore not visible to observers during ship or plane surveys:
For species that don’t stay under water for a long time, the issue can be addressed by having two sets of observers with different viewing fields. On a ship survey, there might be one set using powerful binoculars to search far ahead of the ship. Another set might be using only their eyes to search relatively nearby. On an aerial survey, the plane might circle around after a whale sighting and survey the same transect part again: a so-called “racetrack” survey.
The sightings of these two sets of observers (or one set of observers two times regarding racetrack) are compared and sightings of the same group of whales (duplicate sightings) identified. The analyst uses the data to estimate the proportion of whales that would have been missed if there had been only one set of observers searching close to the ship and then uses this to correct the estimate of abundance.
An alternate approach uses information on the diving habits of the target species, such as the proportion of time the whale spends at or near the surface and the frequency of dives. These data come from external studies, often involving the application of satellite or radio tags that record and transmit information on the activities of the animal. This information is combined with data from the survey to estimate the probability that an animal would have been visible (or not) during the passage of the ship or plane and this is then used to correct the estimate of abundance.
5. Question: Don’t ships and airplanes scare the whales away?
Answer: This is more of an issue for ships than for aircraft, because aircraft move so quickly that a whale does not have time to flee even if it does hear the plane. Whales can have differing responses to ships. For example, some species of dolphins are attracted to ships and approach them, even surfing on the ship’s bow wave. Other species do tend to leave the area when they sense the approach of a ship. Still others, such as fin whales, do not seem to react to ships much at all. Either type of responsive movement – aversive (fleeing) or attractive (approaching) – can be problematic because it can lead to underestimation of density with aversive movement or overestimation with attractive movement.
The problem is addressed in the same way as that of diving whales, by having two sets of observers with different viewing fields. In this case, the distribution of perpendicular distances for each team is compared to determine if responsive movement has occurred. For example, if attractive movement is occurring, the team using naked eyes only will tend to see a greater proportion of animals close to the transect, because the whales are approaching the ship after being sighted by the team using binoculars. In some cases, the team using binoculars actually tracks individual pods of whales to determine how they respond to the ship. The analyst uses these data to adjust the estimate of effective strip width to account for the responsive movement observed.
6. Question: Whales move around, and could move between transect lines during the survey. How do you know you are not counting the same whales again and again?
Answer: It could happen that the same group of whales is counted twice during a survey. However it is assumed that the whales move in such a way that they are equally likely to be not counted at all. For example a whale might move near to a transect immediately after the ship or plane has passed. Therefore the movement of whales, if it is random, should have no overall effect on the number of whales seen. Whale movement can be an issue if surveys take place during a time when the whales are migrating. In such a case, the survey proceeds in a direction opposite to the movement of the whales, so that the survey does not count the same animals multiple times.


